Exploratory Data Analysis
Distributions of Variables
First, the distribution of rating, review count, distance, size level, and price level were plotted in Figure 1, which shows that ratings are left-skewed, while review count and distance are right-skewed. Moreover, most of the restaurants are single locations, while most of the known price levels are in the medium category.
The distribution of the broader categories of restaurant type in Figure 2 reveals that a large number of restaurants were uncategorized by type and cuisine. Figure 3 also showed that of the categorized restaurants, there was the highest number of bars and east Asian restaurants.
Rating, Review Count, Distance, Size Level, and Price Level
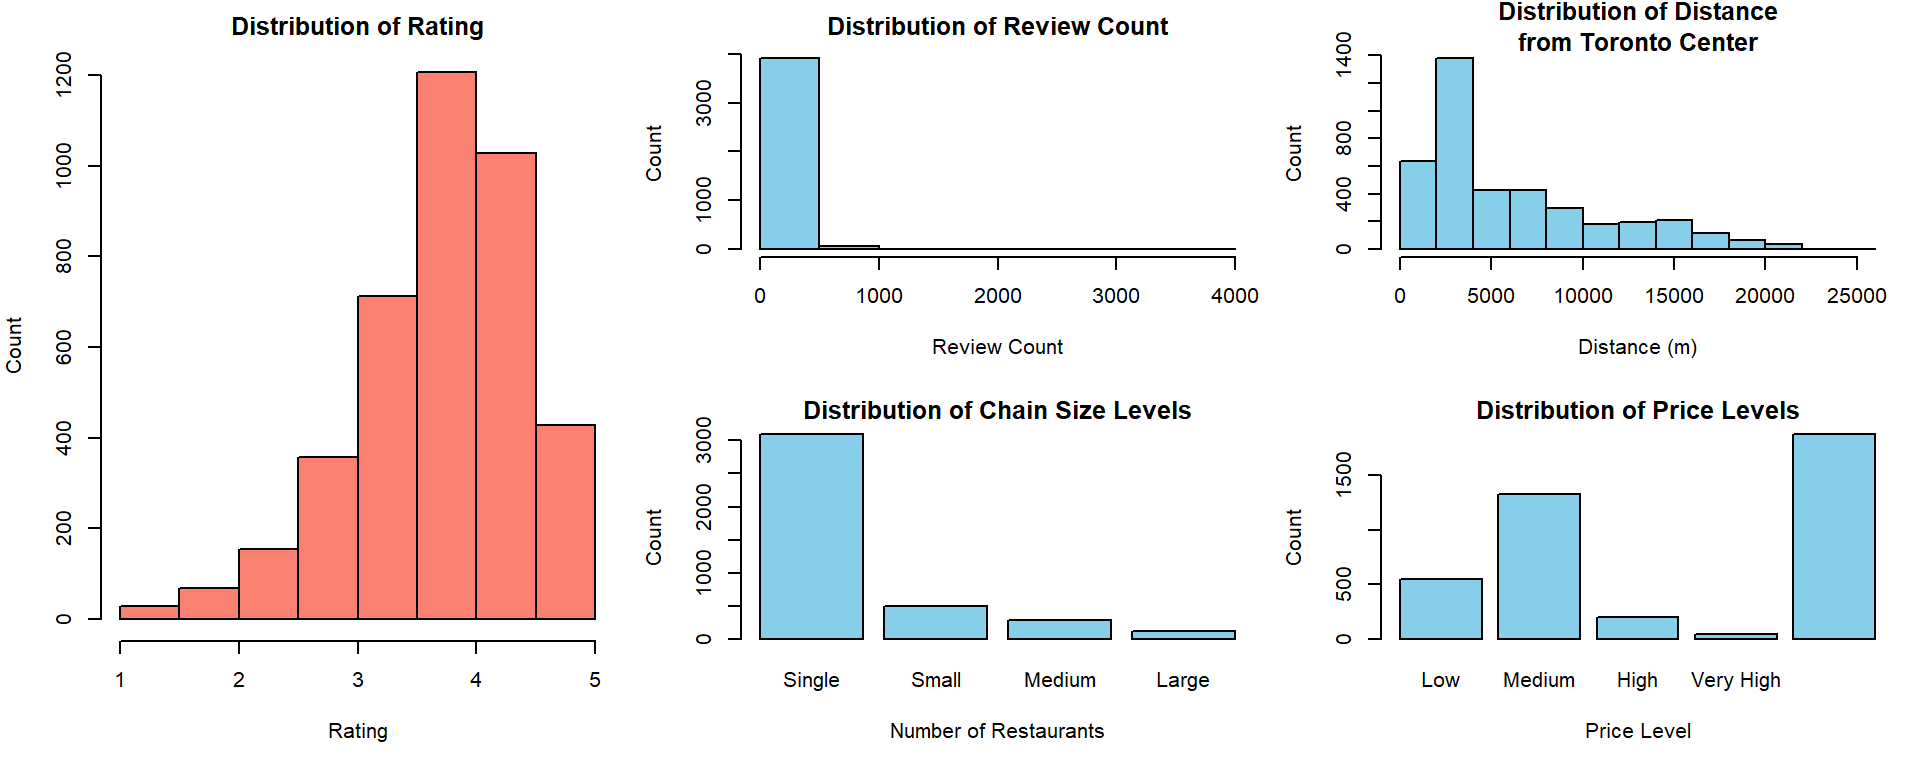
Figure 1. Distribution of rating, review count, distance, size level, and price level
Type
Figure 2. Distribution of restaurant type
Cuisine
Figure 3. Distribution of cuisine
Distribution of Restaurants and Ratings by Neighbourhood
The distribution on the map in Figure 4 suggests that neighbourhoods in the downtown area have the highest number of restaurants. However, the mapped distribution of average ratings in Figure 5 shows no clear spatial clustering for ratings. Comparing the two tables and maps, the neighbourhoods with high average ratings have a lower number of restaurants and lower average review count.
Restaurants
Figure 4. Distribution of restaurants by neighbourhood
Ratings
Figure 5. Distribution of average ratings by neighbourhood
Distribution of Ratings by Other Categorical Variables
Looking at the boxplot showing the distribution of restaurant ratings by size level in Figure 6, the size of the chain has a negative relationship with median rating, with smaller-size restaurants having higher ratings on average. All size levels have similar spreads of ratings. Similarly, the boxplot of ratings by price level also displayed in Figure 7 suggests that the rating of a restaurant increases with price level, though restaurants with unknown price level have the highest median rating. The spread of ratings also decreases with price level.
The boxplot showing the ratings by restaurant type, Figure 8, shows that bistros and cafes/bakeries have the highest median ratings, while diners and fast food have the lowest median ratings. Fast food restaurants have the largest spread of ratings. The distribution of restaurant ratings by cuisine is plotted in Figure 7, which shows international and Middle Eastern cuisines having the highest median ratings, while North American cuisine has the lowest median rating.
Size Level
Figure 6. Distribution of restaurant ratings by size level
Price Level
Figure 7. Distribution of restaurant ratings by price level
Type
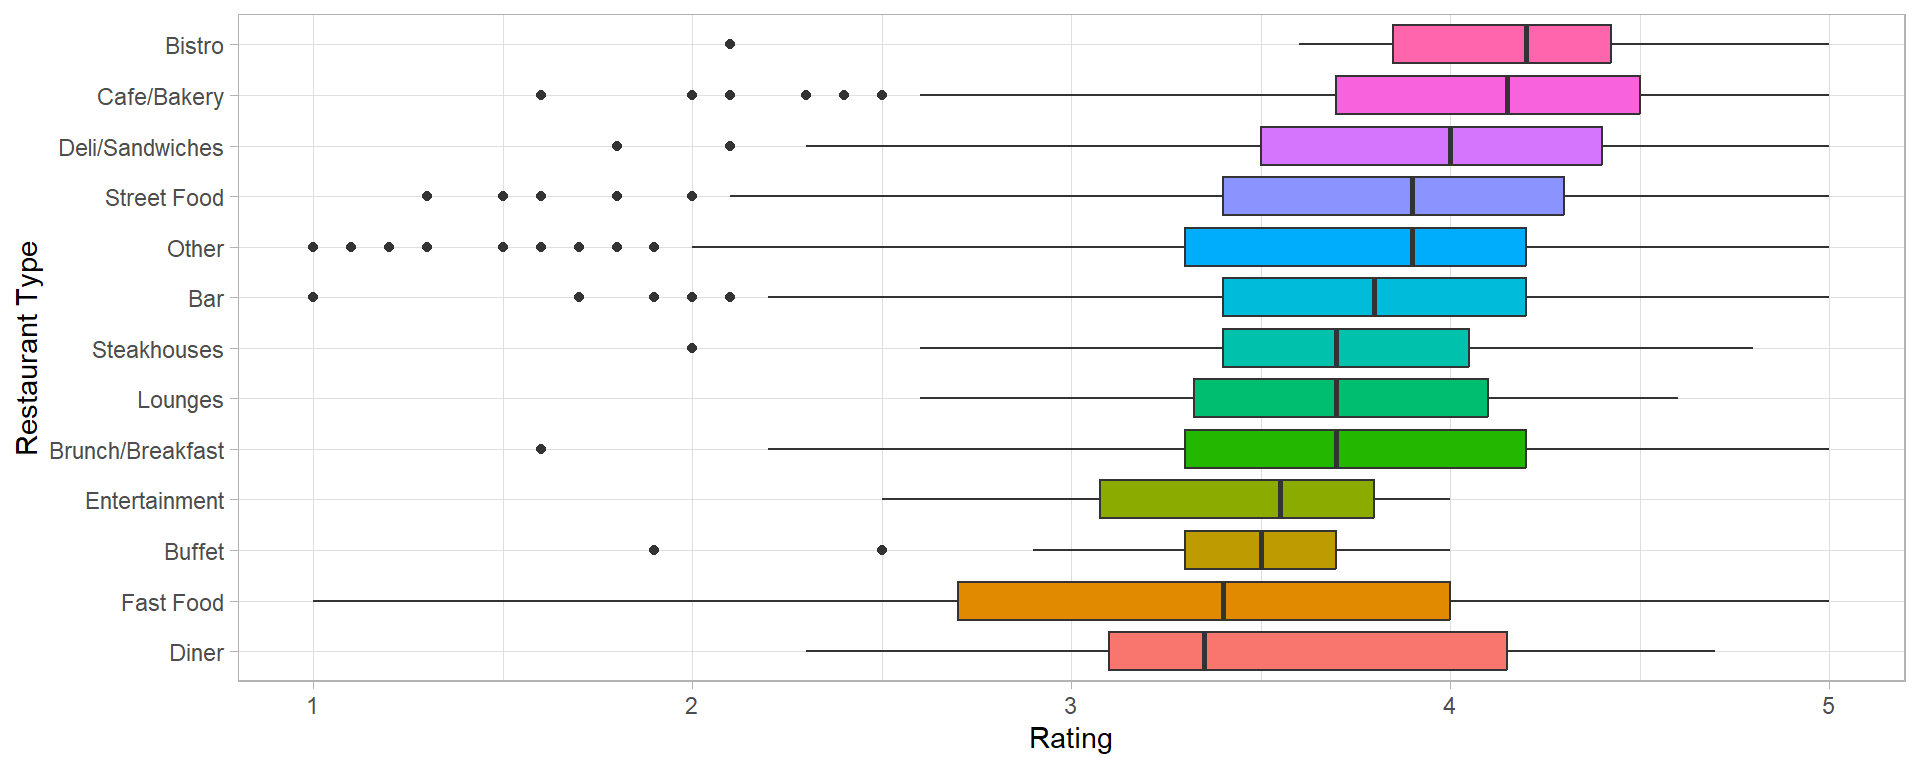
Figure 8. Distribution of restaurant ratings by restaurant type
Cuisine
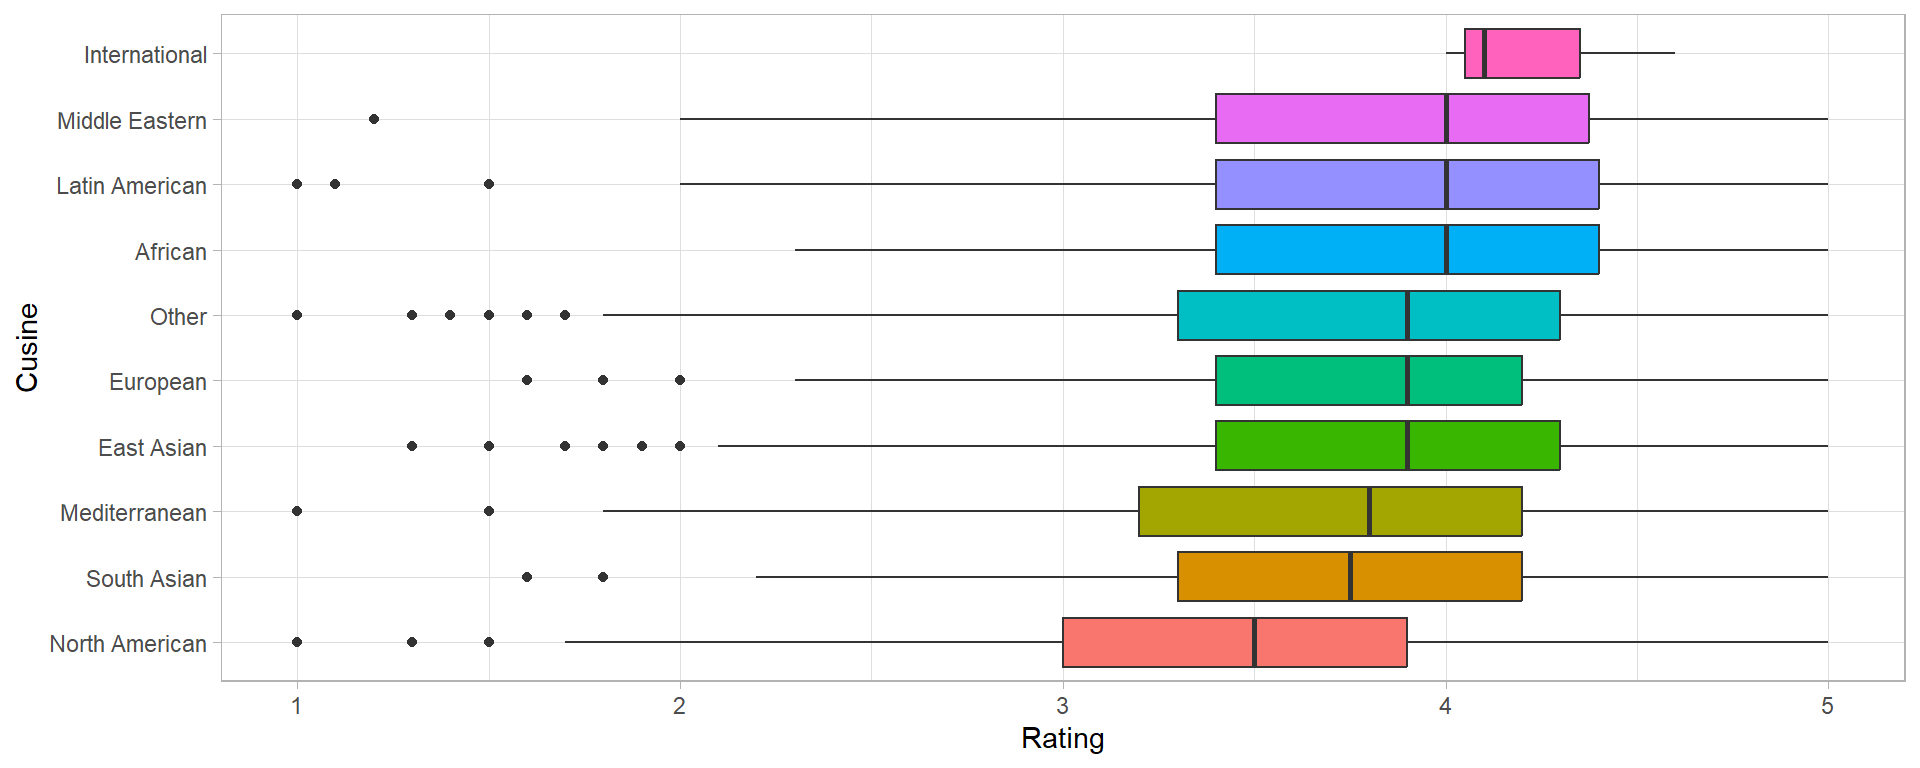
Figure 9. Distribution of restaurant ratings by cuisine
Relationships between Rating and Numeric Variables
The scatter plots in Figures 10 to 13 do not show any clear trends for dsitance, review count, longitude, or latitude with rating.
Review Count
Figure 10. Review Count vs Rating
Distance
Figure 11. Distance vs Rating
Longitude
Figure 12. Longitude vs Rating
Latitude
Figure 13. Latitude vs Rating