Modelling
Overall Regression Results
Table 1 suggests that the gradient boosting model had the best overall performance, with a somewhat low train RMSE and the lowest test RMSE. The random forest model had the lowest train RMSE, but a higher test RMSE, suggesting possible overfitting.
| Method | Train RMSE | Test RMSE |
|---|---|---|
| Linear Regression | 0.634 | 0.634 |
| Auto. Lin. Reg. | 0.634 | 0.634 |
| GLMM | 0.620 | 0.630 |
| Regression Tree | 0.640 | 0.633 |
| Random Forest | 0.323 | 0.635 |
| Boosting | 0.597 | 0.626 |
| XGBoost | 0.545 | 0.630 |
Linear Regression Coefficients
Figure 1 shows the estimated coefficients from a baseline linear regression model. Notably, all of the size levels have statistically significant effects at the 0.05 significance level. For example, large chains have a 0.921 lower rating than single location restaurants on average. Moreover, two of the price levels have statistically significant effects: Very High and Unknown, compared to the baseline level of Low. Review count also has small, but statistically significant effect
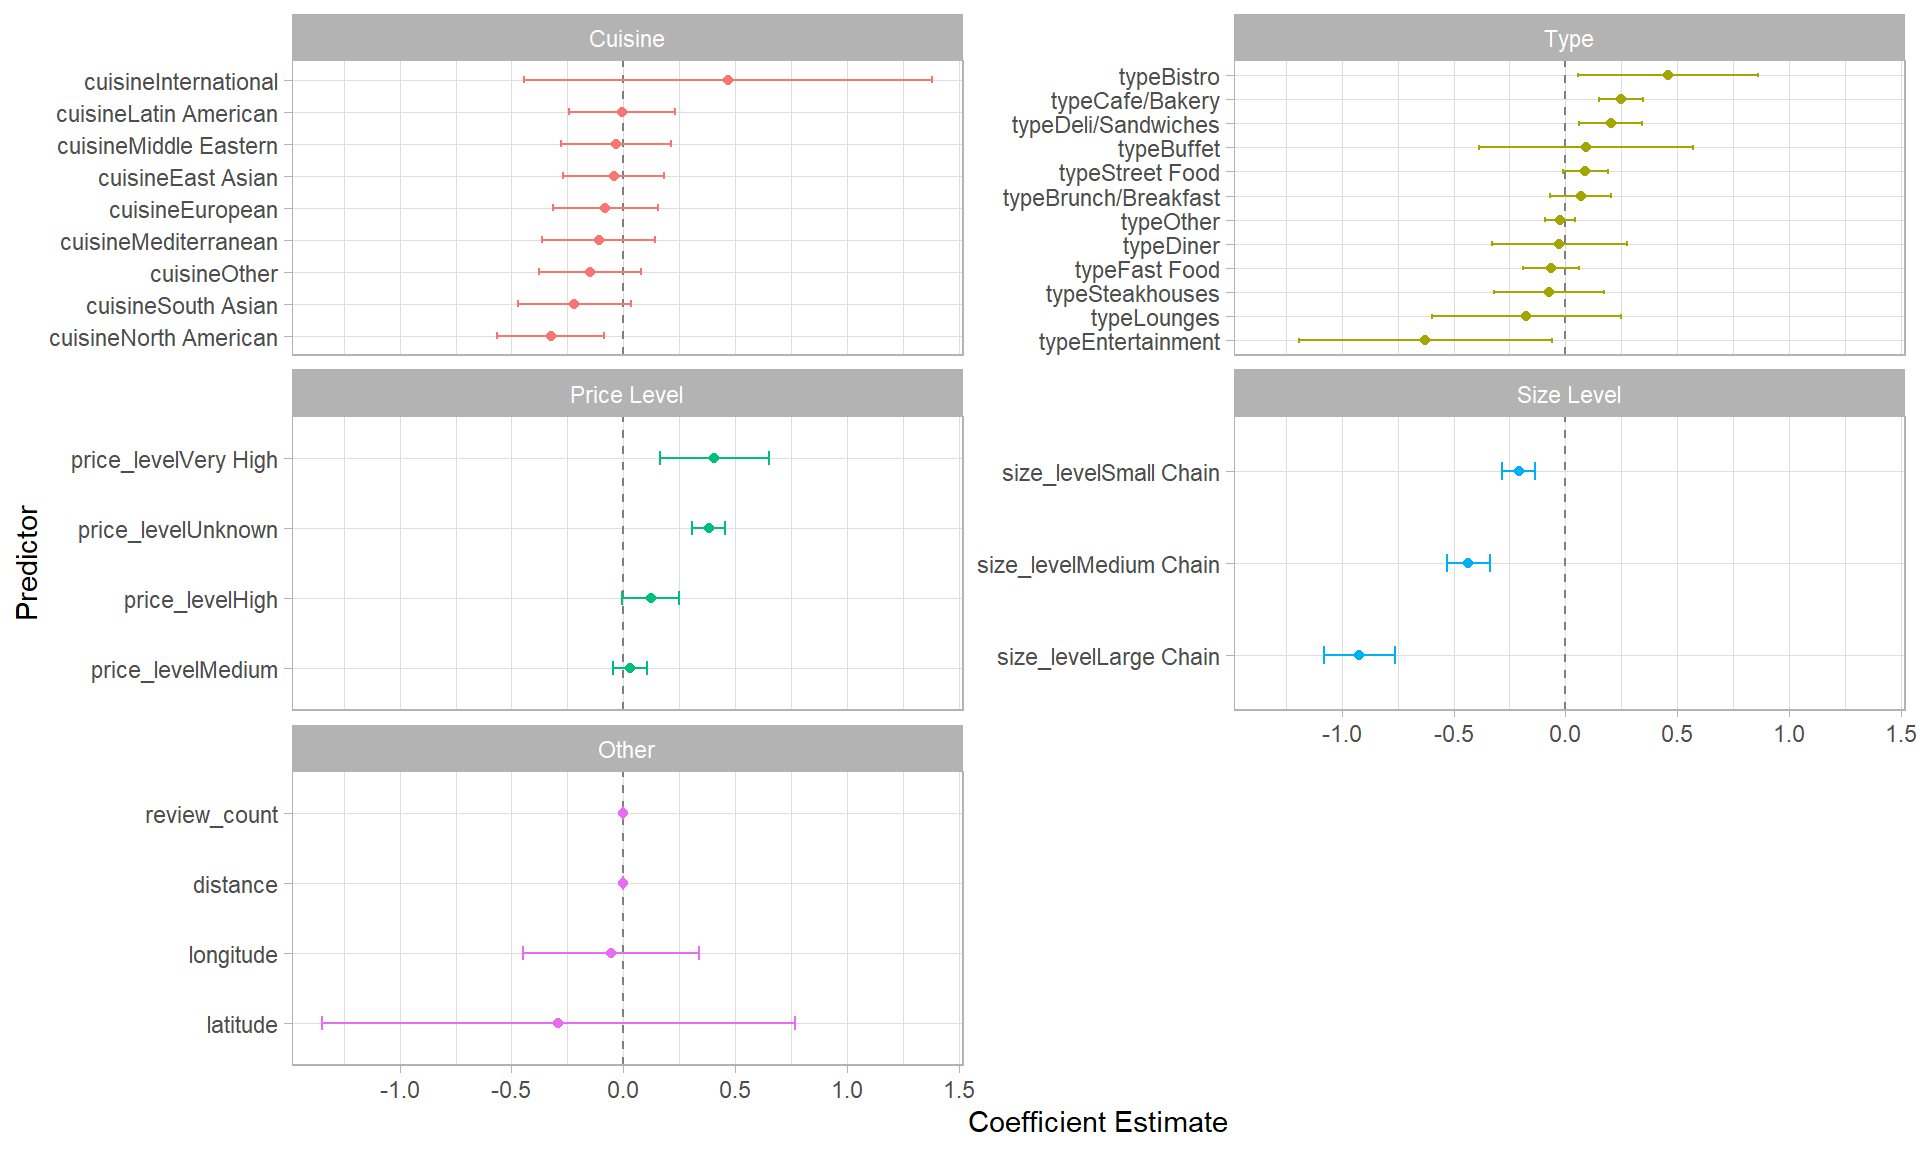
Figure 1. Coefficients and their 95% confidence interval for the baseline linear model
Variable Importances
Figure 2 shows the rankings of each variable in the random forest, boosting and XGBoost models. There is a lot of variations between the rankings, but overall, size level appears to be the most important.
Figure 2. Differences in Variable Importance Rankings Over Models